 Cihan University-Erbil Alumni Association under the auspice of the Career Development Directorate
First Report / July 2019
This report serves the purpose of indicating the information and analysis about the statistics in regards to the Alumni of Cihan University – Erbil which relies on the latest information from the statistics department of the Alumni association.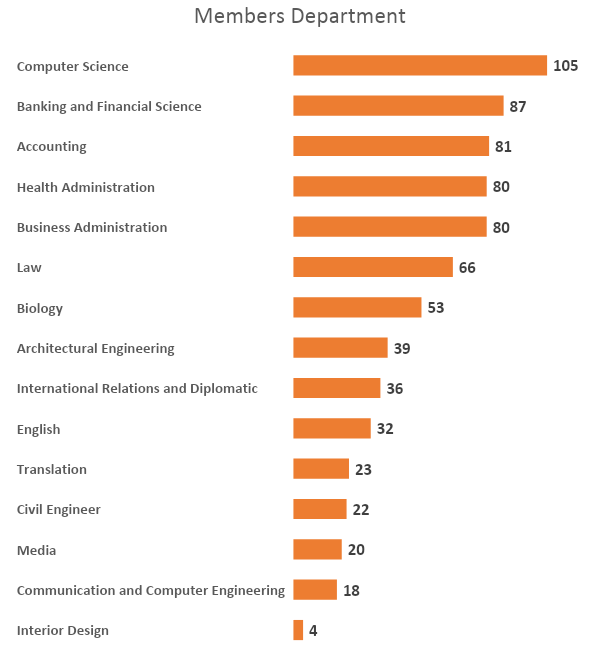
This Bar chart summarizes the number of alumni members which is 746. Most of which are graduates from these departments: Computer science, Banking and Financial Science and Accounting.
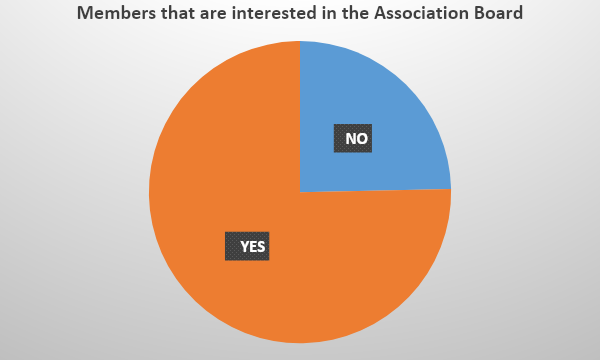
This pie chart shows the ratio of alumni members that also display interest to work alongside the Alumni Board Association. They consist of 75% of interested candidates who will go under a procedure of rules and criteria and ultimately selected by the board to become members of the syndicate.
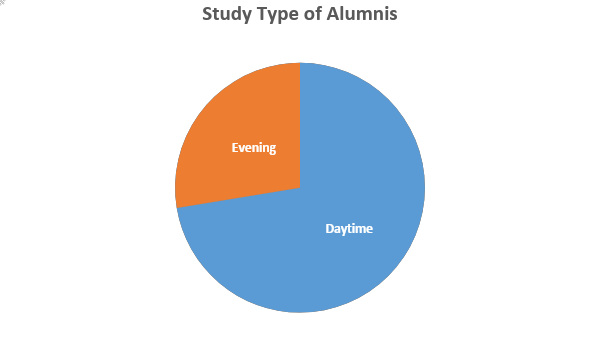
As we have mentioned before, those that became Alumni after graduation are subdivided into 2 study groups. The majority of which is comprised of students studying during daytime, which are 72%, and the rest study during the evening, which are the complementary 28%. This ratio resembles reality as we have more students during the daytime.
Our inquiries also revealed through this pie chart that most of our Alumni are not working as of right now after their graduation which is 24%. However, there are 3 more types of alumni. Those that work in a public sector e.g. for the government which constitutes 32%. As well as those that work for private sectors e.g. institutions, NGOs etc. which are 43% of the whole. Furthermore, there’s a small percentage of 1% that are continuing their studies after their successful graduation.
| Department of | Doing Further Studies | Not Working | Private sector | Public Sector | Total |
| Accounting | 0 | 48 | 22 | 11 | 81 |
| Architectural Engineering | 1 | 31 | 6 | 1 | 39 |
| Banking and Financial Science | 1 | 58 | 15 | 13 | 87 |
| Biology | 1 | 30 | 18 | 4 | 53 |
| Business Administration | 0 | 45 | 32 | 3 | 80 |
| Civil Engineering | 0 | 15 | 7 | 0 | 22 |
| Communication and Computer Engineering | 0 | 12 | 6 | 0 | 18 |
| Computer Science | 3 | 36 | 51 | 15 | 105 |
| English | 0 | 20 | 11 | 1 | 32 |
| Health Administration | 1 | 65 | 10 | 4 | 80 |
| Interior Design | 0 | 2 | 2 | 0 | 4 |
| International Relations and Diplomatic | 0 | 22 | 2 | 12 | 36 |
| Law | 0 | 36 | 13 | 17 | 66 |
| Media | 0 | 9 | 5 | 6 | 20 |
| Translation | 0 | 10 | 11 | 2 | 23 |
| Total | 7 | 439 | 211 | 89 | 746 |
Working and Non-working Alumni in regards to each Department
This table shows the ratio of students working and not working according to each department. It effectively indicates which department has the largest number of working alumni. Again the department of Computer Science has the highest number of working alumni with 51 working for private sectors and 15 working for the public sector. In addition, it shows the small percentage of students continuing their studies e.g. M.Sc. / M.A. or PhD after their graduation.